Population Differentiation for Sequence Data
Introduction
Now, we will discuss in more detail how to assess population genetic structure from sequence data. Assuming that you have a priori information about how the individuals are grouped in subpopulations, one can do the following analyses: 1) quantify pairwise subpopulation structure and their significance, 2) test for hierarchical structure among groups of subpopulations, and 3) use population clustering algorithms to corroborate the a priori grouping hypothesis. We will go into each of these analyses in this vignette.
Resources
Data
Data used for the following analyses come from one mitochondrial gene (Cytochrome Oxidase I = ‘Ebom_mt.fas’) and one nuclear gene (Calcium/Calmodulin-Dependent Protein Kinase II = ‘Ebom_CAD.fas’) of the orchid bee Eulaema bombiformis.
Importing data
We will first import FASTA files for all genes at once using the apex function read.multiFASTA(). This will allow us to read in multiple FASTA formatted files at once into a “multiDNA” object from the apex package. We can plot it to see what the two genes look like for all of our samples
# Creating DNAbin objects
beeData <- read.multiFASTA(c("Ebom_mt.fas", "Ebom_CAD.fas"))
plot(beeData, cex = 0.2)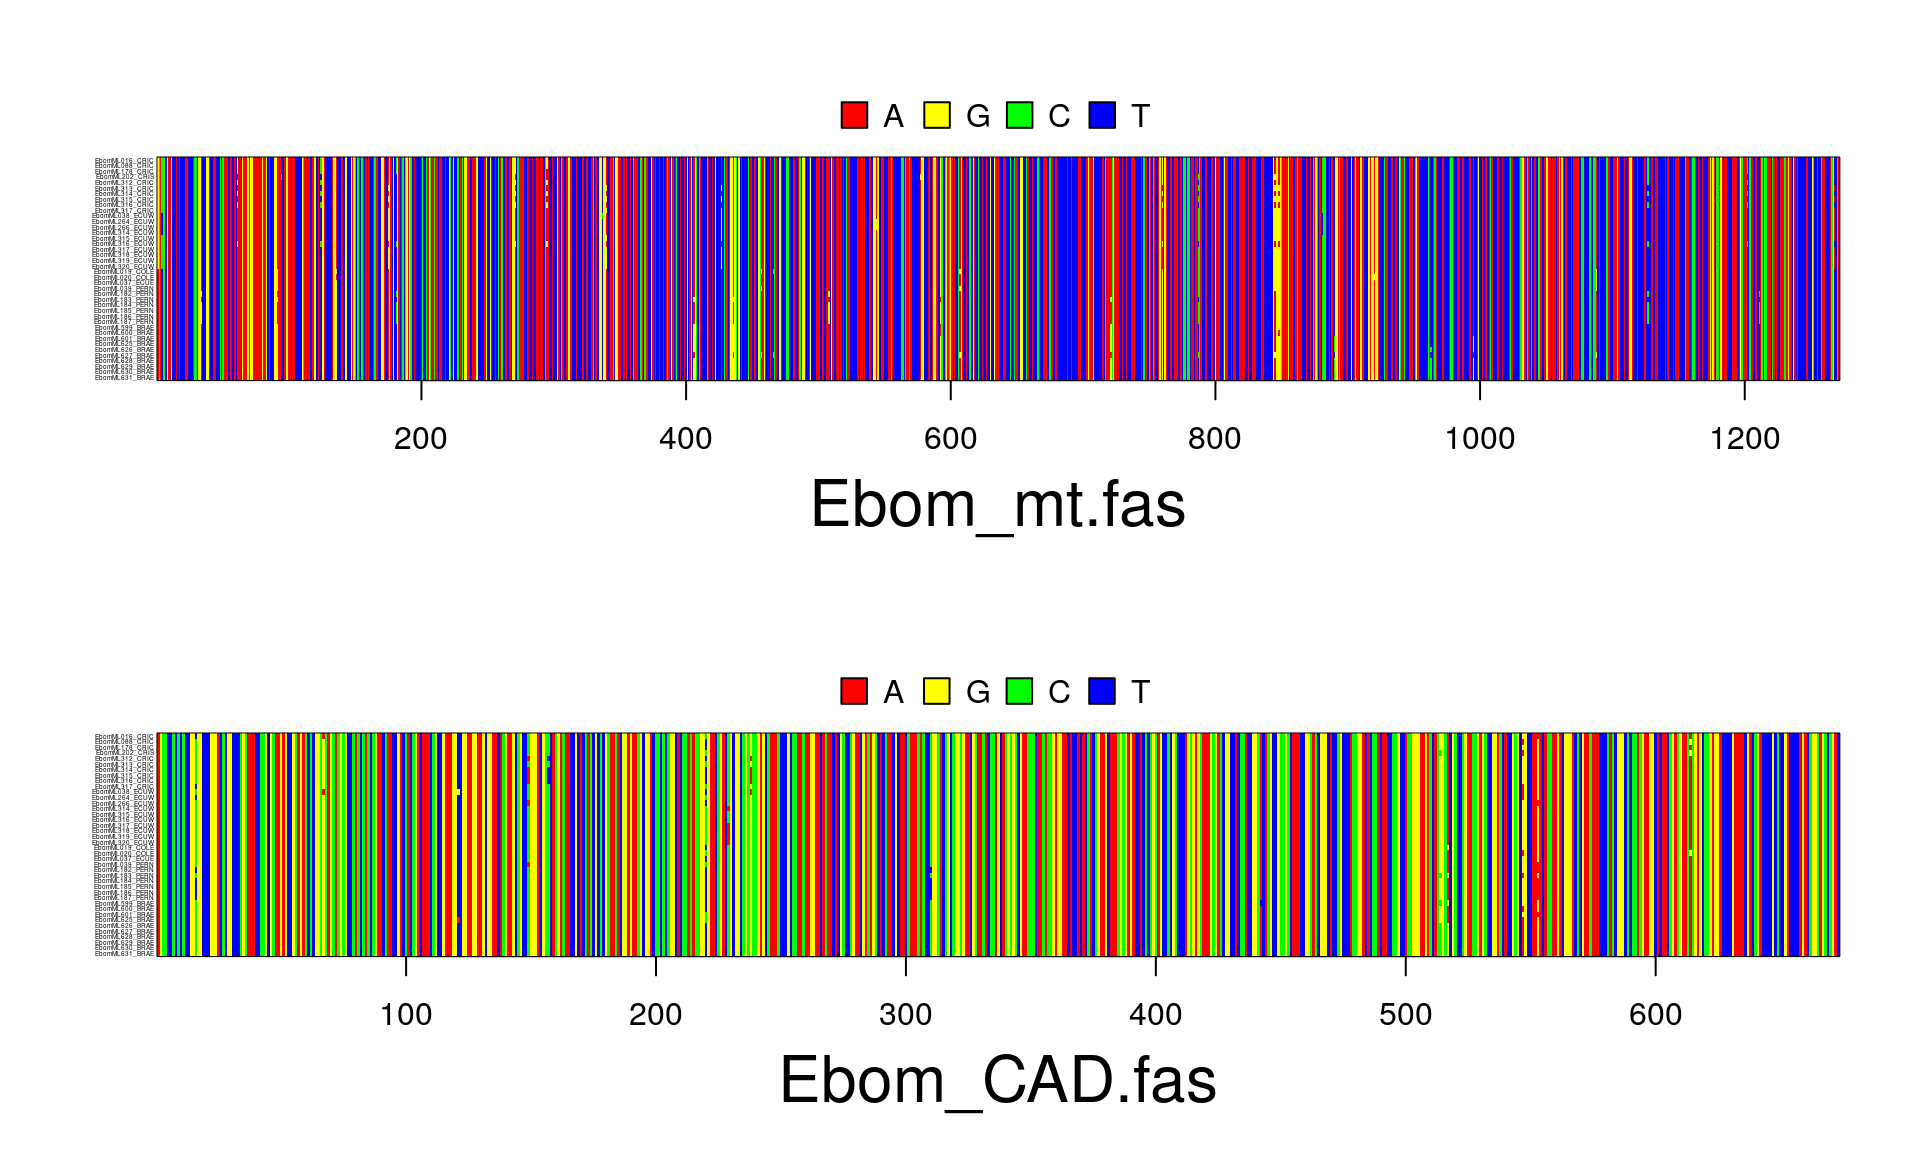
Pro tip: You can list all the files ending in “.fas” in your folder by using
dir(pattern = "fas", full.names = TRUE)
Now, this “multidna” object (beeData) will be converted into a “genind” object (beeData.gid), which will be used for downstream analyses. One thing we need to be aware of is the fact that we can’t have any periods in our locus names. By default, the locus names are set to the file names, which both contain “.fas” in the title. We can fix this by using the text-replacing function gsub():
## [1] "Ebom_mt.fas" "Ebom_CAD.fas"## [1] "Ebom_mt" "Ebom_CAD"Now we can create our “genind” object.
# Creating genind object by multilocus sequence types
beeData.gid <- multidna2genind(beeData, mlst = TRUE)
beeData.gid
## /// GENIND OBJECT /////////
##
## // 40 individuals; 2 loci; 36 alleles; size: 51.7 Kb
##
## // Basic content
## @tab: 40 x 36 matrix of allele counts
## @loc.n.all: number of alleles per locus (range: 17-19)
## @loc.fac: locus factor for the 36 columns of @tab
## @all.names: list of allele names for each locus
## @ploidy: ploidy of each individual (range: 1-1)
## @type: codom
## @call: df2genind(X = xdfnum, ind.names = x@labels, ploidy = 1)
##
## // Optional content
## - empty -We also want to set the population strata.
my_strata <- data.frame(regions = rep(c("West", "East"), each = 20),
                        populations = rep(c("CA", "Ch", "Am", "AF"), each = 10))
strata(beeData.gid) <- my_strata
setPop(beeData.gid) <- ~populations
beeData.gid
## /// GENIND OBJECT /////////
##
## // 40 individuals; 2 loci; 36 alleles; size: 54.7 Kb
##
## // Basic content
## @tab: 40 x 36 matrix of allele counts
## @loc.n.all: number of alleles per locus (range: 17-19)
## @loc.fac: locus factor for the 36 columns of @tab
## @all.names: list of allele names for each locus
## @ploidy: ploidy of each individual (range: 1-1)
## @type: codom
## @call: df2genind(X = xdfnum, ind.names = x@labels, ploidy = 1)
##
## // Optional content
## @pop: population of each individual (group size range: 10-10)
## @strata: a data frame with 2 columns ( regions, populations )Pairwise population differentiation
Overall F-statistics
## $per.locus
##                 Hs        Ht       Gst Gprime_st         D
## Ebom_mt  0.7421053 0.9117763 0.1860885 0.9058976 0.8772109
## Ebom_CAD 0.7263158 0.9190789 0.2097351 0.9550196 0.9391026
##
## $global
##        Hs        Ht   Gst_est Gprime_st     D_het    D_mean
## 0.7342105 0.9154276 0.1979590 0.9315893 0.9090759 0.9071022## $per.locus
## Ebom_mt Ebom_CAD
## 0.8817688 0.9443099
##
## $global
## [1] 0.8938182Pairwise Fst
##            CA         Ch         Am
## Ch 0.08227848
## Am 0.12513019 0.15853659
## AF 0.14803625 0.18012422 0.15297092## CA Ch Am
## Ch 0.6419753
## Am 0.9828211 1.0000000
## AF 1.0000000 1.0000000 0.9002976## CA Ch Am
## Ch 0.5636175
## Am 0.9780685 1.0000000
## AF 1.0007468 1.0012306 0.8632757Testing for significance
To estimate if populations are significantly different, we will generate 100 replicates of the dataset using the function chao_bootstrap(). Then, summary statistics (mean and 95% CI) will be calculated for each of the different parameters of population differentiation.
##
## Estimates for each locus
## Locus    Mean     95% CI
## Ebom_mt  0.1861  (0.080-0.292)
## Ebom_CAD 0.2097  (0.116-0.304)
##
## Global Estimate based on average heterozygosity
## 0.1980 (0.128-0.267)##
## Estimates for each locus
## Locus Mean 95% CI
## Ebom_mt 0.9059 (0.851-0.960)
## Ebom_CAD 0.9550 (0.905-1.005)
##
## Global Estimate based on average heterozygosity
## 0.9316 (0.898-0.966)##
## Estimates for each locus
## Locus Mean 95% CI
## Ebom_mt 0.8772 (0.802-0.952)
## Ebom_CAD 0.9391 (0.870-1.008)
##
## Global Estimate based on average heterozygosity
## 0.9091 (0.861-0.957)
##
## Global Estimate based on harmonic mean of statistic
## 0.9071 (0.859-0.955)AMOVA (Analysis of Molecular Variance)
Analysis of Molecular Variance (AMOVA) is a method for estimating population differentiation from molecular data taking into account the mutational distance between alleles. Unlike \(F_{st}\), which quantifies genetic differentiation based on allele frequencies, AMOVA treats molecular data as vectors and estimates Euclidean distances between alleles. Furthermore, it is possible to test hypotheses about differentiation by grouping subpopulations in a hierarchical structure (Excoffier et al., 1992).
beeData_dist <- dist.multidna(beeData, pool = TRUE)
amova(beeData_dist ~ populations, data = strata(beeData.gid), nperm = 100)
##
## Analysis of Molecular Variance
##
## Call: amova(formula = beeData_dist ~ populations, data = strata(beeData.gid),
## nperm = 100)
##
## SSD MSD df
## populations 0.0009468508 3.156169e-04 3
## Error 0.0005930812 1.647448e-05 36
## Total 0.0015399320 3.948544e-05 39
##
## Variance components:
## sigma2 P.value
## populations 2.9914e-05 0
## Error 1.6474e-05
##
## Phi-statistics:
## populations.in.GLOBAL
## 0.6448603
##
## Variance coefficients:
## a
## 10Conclusions
In this vignette, we learned how to estimate different parameters of overall and pairwise population differentiation (Nei’s Gst, Hedrick’s Gst, Jost D) from DNA sequence data. We also learned how to do a hierarchical analysis of population structure using AMOVA.
What’s next
With these exploratory analyses, we understand how genetic diversity is distributed among populations. One could now move to testing specific hypotheses than could explain the patterns of population structure found with the F-statistics.
Contributors
- Margarita M. López- Uribe (Author)
- Zhian N. Kamvar (edits)
References
Excoffier L., Smouse PE., Quattro JM. 1992. Analysis of molecular variance inferred from metric distances among dNA haplotypes: Application to human mitochondrial dNA restriction data. Genetics 131:479–491. Available at: http://www.genetics.org/content/131/2/479.abstract
Session Information
This shows us useful information for reproducibility. Of particular importance are the versions of R and the packages used to create this workflow. It is considered good practice to record this information with every analysis.
## ─ Session info ───────────────────────────────────────────────────────────────────────────────────
##  setting  value
##  version  R version 3.6.1 (2019-07-05)
##  os       Debian GNU/Linux 9 (stretch)
##  system   x86_64, linux-gnu
##  ui       X11
##  language (EN)
##  collate  en_US.UTF-8
##  ctype    en_US.UTF-8
##  tz       Etc/UTC
##  date     2019-09-16
##
## ─ Packages ───────────────────────────────────────────────────────────────────────────────────────
##  package     * version  date       lib source
##  ade4        * 1.7-13   2018-08-31 [1] CRAN (R 3.6.1)
##  adegenet    * 2.1.1    2018-02-02 [1] CRAN (R 3.6.1)
##  ape         * 5.3      2019-03-17 [1] CRAN (R 3.6.1)
##  apex        * 1.0.3    2017-09-23 [1] CRAN (R 3.6.1)
##  assertthat    0.2.1    2019-03-21 [1] CRAN (R 3.6.1)
##  backports     1.1.4    2019-04-10 [1] CRAN (R 3.6.1)
##  boot          1.3-22   2019-04-02 [2] CRAN (R 3.6.1)
##  callr         3.3.1    2019-07-18 [1] CRAN (R 3.6.1)
##  class         7.3-15   2019-01-01 [2] CRAN (R 3.6.1)
##  classInt      0.4-1    2019-08-06 [1] CRAN (R 3.6.1)
##  cli           1.1.0    2019-03-19 [1] CRAN (R 3.6.1)
##  cluster       2.1.0    2019-06-19 [2] CRAN (R 3.6.1)
##  coda          0.19-3   2019-07-05 [1] CRAN (R 3.6.1)
##  colorspace    1.4-1    2019-03-18 [1] CRAN (R 3.6.1)
##  crayon        1.3.4    2017-09-16 [1] CRAN (R 3.6.1)
##  DBI           1.0.0    2018-05-02 [1] CRAN (R 3.6.1)
##  deldir        0.1-23   2019-07-31 [1] CRAN (R 3.6.1)
##  desc          1.2.0    2018-05-01 [1] CRAN (R 3.6.1)
##  devtools      2.2.0    2019-09-07 [1] CRAN (R 3.6.1)
##  digest        0.6.20   2019-07-04 [1] CRAN (R 3.6.1)
##  dplyr         0.8.3    2019-07-04 [1] CRAN (R 3.6.1)
##  DT            0.8      2019-08-07 [1] CRAN (R 3.6.1)
##  e1071         1.7-2    2019-06-05 [1] CRAN (R 3.6.1)
##  ellipsis      0.2.0.1  2019-07-02 [1] CRAN (R 3.6.1)
##  evaluate      0.14     2019-05-28 [1] CRAN (R 3.6.1)
##  expm          0.999-4  2019-03-21 [1] CRAN (R 3.6.1)
##  fastmatch     1.1-0    2017-01-28 [1] CRAN (R 3.6.1)
##  fs            1.3.1    2019-05-06 [1] CRAN (R 3.6.1)
##  gdata         2.18.0   2017-06-06 [1] CRAN (R 3.6.1)
##  ggplot2       3.2.1    2019-08-10 [1] CRAN (R 3.6.1)
##  glue          1.3.1    2019-03-12 [1] CRAN (R 3.6.1)
##  gmodels       2.18.1   2018-06-25 [1] CRAN (R 3.6.1)
##  gtable        0.3.0    2019-03-25 [1] CRAN (R 3.6.1)
##  gtools        3.8.1    2018-06-26 [1] CRAN (R 3.6.1)
##  htmltools     0.3.6    2017-04-28 [1] CRAN (R 3.6.1)
##  htmlwidgets   1.3      2018-09-30 [1] CRAN (R 3.6.1)
##  httpuv        1.5.2    2019-09-11 [1] CRAN (R 3.6.1)
##  igraph        1.2.4.1  2019-04-22 [1] CRAN (R 3.6.1)
##  KernSmooth    2.23-15  2015-06-29 [2] CRAN (R 3.6.1)
##  knitr         1.24     2019-08-08 [1] CRAN (R 3.6.1)
##  later         0.8.0    2019-02-11 [1] CRAN (R 3.6.1)
##  lattice       0.20-38  2018-11-04 [2] CRAN (R 3.6.1)
##  lazyeval      0.2.2    2019-03-15 [1] CRAN (R 3.6.1)
##  LearnBayes    2.15.1   2018-03-18 [1] CRAN (R 3.6.1)
##  magrittr      1.5      2014-11-22 [1] CRAN (R 3.6.1)
##  MASS          7.3-51.4 2019-03-31 [2] CRAN (R 3.6.1)
##  Matrix        1.2-17   2019-03-22 [2] CRAN (R 3.6.1)
##  memoise       1.1.0    2017-04-21 [1] CRAN (R 3.6.1)
##  mgcv          1.8-28   2019-03-21 [2] CRAN (R 3.6.1)
##  mime          0.7      2019-06-11 [1] CRAN (R 3.6.1)
##  mmod        * 1.3.3    2017-04-06 [1] CRAN (R 3.6.1)
##  munsell       0.5.0    2018-06-12 [1] CRAN (R 3.6.1)
##  nlme          3.1-140  2019-05-12 [2] CRAN (R 3.6.1)
##  pegas       * 0.11     2018-07-09 [1] CRAN (R 3.6.1)
##  permute       0.9-5    2019-03-12 [1] CRAN (R 3.6.1)
##  phangorn    * 2.5.5    2019-06-19 [1] CRAN (R 3.6.1)
##  pillar        1.4.2    2019-06-29 [1] CRAN (R 3.6.1)
##  pkgbuild      1.0.5    2019-08-26 [1] CRAN (R 3.6.1)
##  pkgconfig     2.0.2    2018-08-16 [1] CRAN (R 3.6.1)
##  pkgload       1.0.2    2018-10-29 [1] CRAN (R 3.6.1)
##  plyr          1.8.4    2016-06-08 [1] CRAN (R 3.6.1)
##  polysat       1.7-4    2019-03-06 [1] CRAN (R 3.6.1)
##  poppr       * 2.8.3    2019-06-18 [1] CRAN (R 3.6.1)
##  prettyunits   1.0.2    2015-07-13 [1] CRAN (R 3.6.1)
##  processx      3.4.1    2019-07-18 [1] CRAN (R 3.6.1)
##  promises      1.0.1    2018-04-13 [1] CRAN (R 3.6.1)
##  ps            1.3.0    2018-12-21 [1] CRAN (R 3.6.1)
##  purrr         0.3.2    2019-03-15 [1] CRAN (R 3.6.1)
##  quadprog      1.5-7    2019-05-06 [1] CRAN (R 3.6.1)
##  R6            2.4.0    2019-02-14 [1] CRAN (R 3.6.1)
##  Rcpp          1.0.2    2019-07-25 [1] CRAN (R 3.6.1)
##  remotes       2.1.0    2019-06-24 [1] CRAN (R 3.6.1)
##  reshape2      1.4.3    2017-12-11 [1] CRAN (R 3.6.1)
##  rlang         0.4.0    2019-06-25 [1] CRAN (R 3.6.1)
##  rmarkdown     1.15     2019-08-21 [1] CRAN (R 3.6.1)
##  rprojroot     1.3-2    2018-01-03 [1] CRAN (R 3.6.1)
##  scales        1.0.0    2018-08-09 [1] CRAN (R 3.6.1)
##  seqinr        3.6-1    2019-09-07 [1] CRAN (R 3.6.1)
##  sessioninfo   1.1.1    2018-11-05 [1] CRAN (R 3.6.1)
##  sf            0.7-7    2019-07-24 [1] CRAN (R 3.6.1)
##  shiny         1.3.2    2019-04-22 [1] CRAN (R 3.6.1)
##  sp            1.3-1    2018-06-05 [1] CRAN (R 3.6.1)
##  spData        0.3.0    2019-01-07 [1] CRAN (R 3.6.1)
##  spdep         1.1-2    2019-04-05 [1] CRAN (R 3.6.1)
##  stringi       1.4.3    2019-03-12 [1] CRAN (R 3.6.1)
##  stringr       1.4.0    2019-02-10 [1] CRAN (R 3.6.1)
##  testthat      2.2.1    2019-07-25 [1] CRAN (R 3.6.1)
##  tibble        2.1.3    2019-06-06 [1] CRAN (R 3.6.1)
##  tidyselect    0.2.5    2018-10-11 [1] CRAN (R 3.6.1)
##  units         0.6-4    2019-08-22 [1] CRAN (R 3.6.1)
##  usethis       1.5.1    2019-07-04 [1] CRAN (R 3.6.1)
##  vegan         2.5-6    2019-09-01 [1] CRAN (R 3.6.1)
##  withr         2.1.2    2018-03-15 [1] CRAN (R 3.6.1)
##  xfun          0.9      2019-08-21 [1] CRAN (R 3.6.1)
##  xtable        1.8-4    2019-04-21 [1] CRAN (R 3.6.1)
##  yaml          2.2.0    2018-07-25 [1] CRAN (R 3.6.1)
##
## [1] /usr/local/lib/R/site-library
## [2] /usr/local/lib/R/library